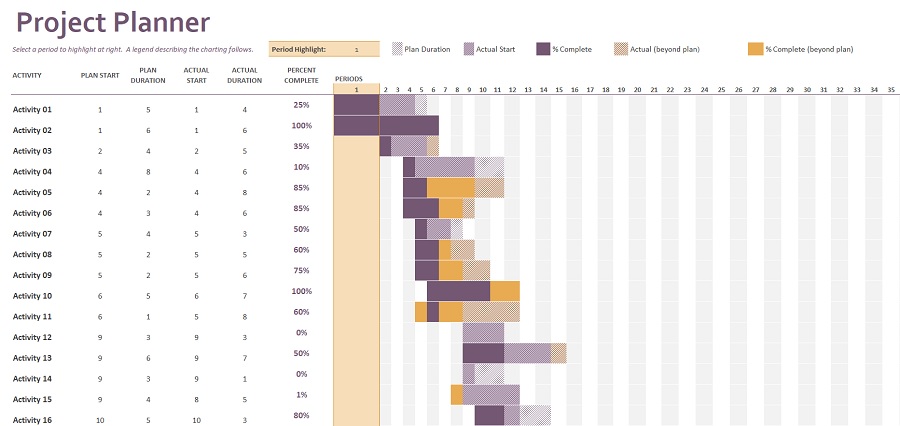
What is a Gantt Chart used for?
Gantt charts are used by project managers for three major reasons:
Create and manage a large project.
Gantt charts represent the project’s components and break them down into smaller, more achievable tasks. The Gantt chart’s timeline is used to organize the resulting little jobs, as well as relationships between tasks, assignees, and milestones.
Determine task dependencies and logistics
Gantt charts may be used to keep track of the logistics of a project. Job dependencies guarantee that a new task may begin only after the previous task has been finished. Dependent issues are automatically rescheduled if a study is delayed (it happens to the best of us). This is especially important when preparing in a multi-team setting.
Keep track of a project’s progress
You may monitor the health of your projects and make improvements as teams record time on issues in your plan. To track the progress of your project, your Gantt chart might incorporate release dates, milestones, or other relevant indicators.

The benefits of using a Gantt Chart
Gantt charts are popular in the project management sector for two basic reasons. They facilitate the creation of complex plans, particularly those involving several teams and shifting deadlines. Gantt charts help companies allocate resources effectively and schedule work around deadlines.
Gantt charts are also utilized by project planners to keep a bird’s eye view of undertakings. They show the link between the start and end dates of tasks, milestones, and dependent tasks, among other things. Modern Gantt chart applications, such as Jira Software with Roadmaps and Advanced Roadmaps, synthesize data and show how different options affect timelines.
The File Contains
- PROJECT PLANNER SHEET
- PLAN START, PLAN DURATION, ACTUAL START, ACTUAL DURATION, PERCENT COMPLETE, PERIODS-60 DAYS, ACTIVITY LIST


